Cloud-Based Remote Sensing with Google Earth Engine
Fundamentals and Applications

Part F6: Advanced Topics
Although you now know the most basic fundamentals of Earth Engine, there is still much more that can be done. The Part presents some advanced topics that can help expand your skill set for doing larger and more complex projects. These include tools for sharing code among users, scaling up with efficient project design, creating apps for non-expert users, and combining R with other information processing platforms.
Chapter F6.3: Sharing Work in Earth Engine: Basic UI and Apps
Author
Qiusheng Wu
Overview
The purpose of this chapter is to demonstrate how to design and publish Earth Engine Apps using both JavaScript and Python. You will be introduced to the Earth Engine User Interface JavaScript API and the geemap Python package. Upon completion of this chapter, you will be able to publish an Earth Engine App with a split-panel map for visualizing land cover change.
Learning Outcomes
- Designing a user interface for an Earth Engine App using JavaScript.
- Publishing an Earth Engine App for visualizing land cover change.
- Developing an Earth Engine App using Python and geemap.
- Deploying an Earth Engine App using a local computer as a web server.
- Publishing an Earth Engine App using Python and free cloud platforms.
- Creating a conda environment using Anaconda/Miniconda.
- Installing Python packages and using Jupyter Notebook.
- Commiting changes to a GitHub repository.
Assumes you know how to:
- Import images and image collections, filter, and visualize (Part F1).
- Use the basic functions and logic of Python.
Github Code link for all tutorials
This code base is collection of codes that are freely available from different authors for google earth engine.
Introduction to Theory
Earth Engine has a user interface API that allows users to build and publish interactive web apps directly from the JavaScript Code Editor. Many readers will have encountered a call to ui.Chart in other chapters, but much more interface functionality is available. In particular, users can utilize the ui functions to construct an entire graphical user interface (GUI) for their Earth Engine script. The GUI may include simple widgets (e.g., labels, buttons, checkboxes, sliders, text boxes) as well as more complex widgets (e.g., charts, maps, panels) for controlling the GUI layout. A complete list of the ui widgets and more information about panels can be found at the links below. Once a GUI is constructed, users can publish the App from the JavaScript Code Editor by clicking the Apps button above the script panel in the Code Editor.
- Widgets: https://developers.google.com/earth-engine/guides/ui_widgets
- Panels: https://developers.google.com/earth-engine/guides/ui_panels
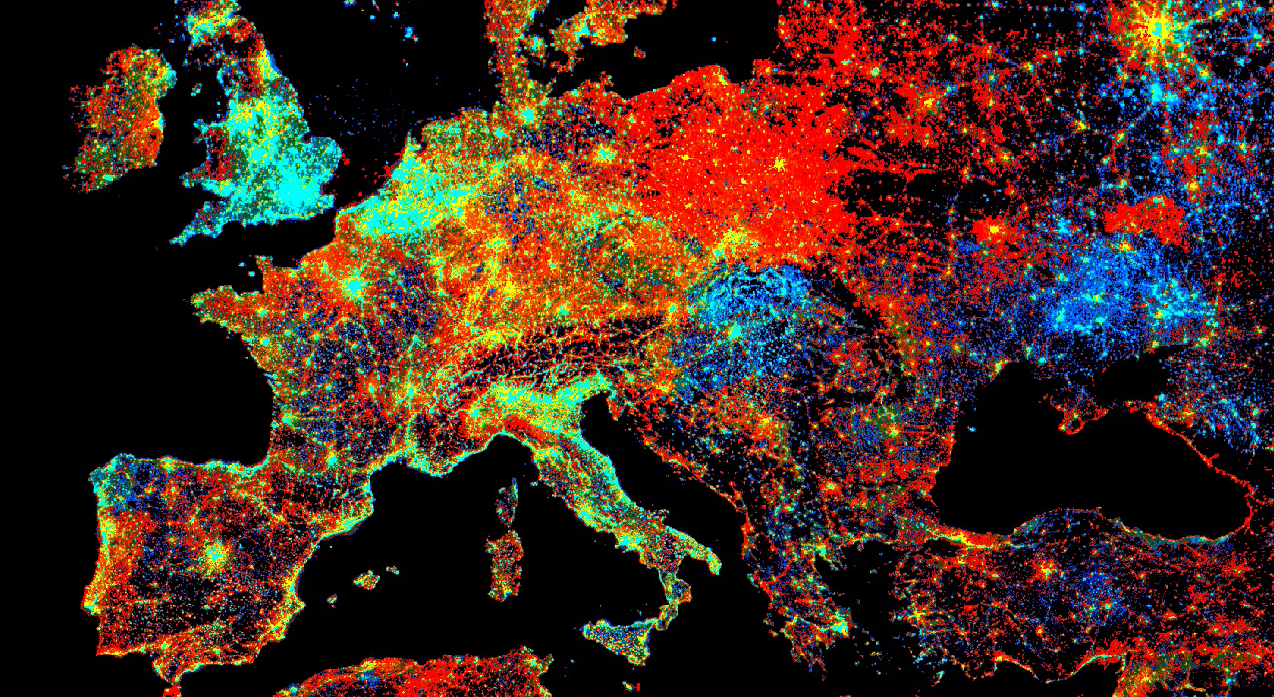
Unlike the Earth Engine JavaScript API, the Earth Engine Python API does not provide functionality for building interactive user interfaces. Fortunately, the Jupyter ecosystem has ipywidgets, an architecture for creating interactive user interface controls (e.g., buttons, sliders, checkboxes, text boxes, dropdown lists) in Jupyter notebooks that communicate with Python code. The integration of graphical widgets into the Jupyter Notebook workflow allows users to configure ad hoc control panels to interactively sweep over parameters using graphical widget controls. One very powerful widget is the output widget, which can be used to display rich output generated by IPython, such as text, images, charts, and videos. A complete list of widgets and more information about the output widget can be found at the links below. By integrating ipyleaflet (for creating interactive maps) and ipywidgets (for designing interactive user interfaces), the geemap Python package (https://geemap.org) makes it much easier to explore and analyze massive Earth Engine datasets via a web browser in a Jupyter environment suitable for interactive exploration, teaching, and sharing. Users can build interactive Earth Engine Apps using geemap with minimal coding (Fig. F6.3.1).
- Widgets: https://ipywidgets.readthedocs.io/en/latest/examples/Widget%20List.html
- Output: https://ipywidgets.readthedocs.io/en/latest/examples/Output%20Widget.html
Fig. F6.3.1 The GUI of geemap in a Jupyter environment |
Practicum
Section 1. Building an Earth Engine App Using JavaScript
In this section, you will learn how to design a user interface for an Earth Engine App using JavaScript and the Earth Engine User Interface API. Upon completion of this section, you will have an Earth Engine App with a split-panel map for visualizing land cover change using the Landsat-based United States Geological Survey National Land Cover Database (NLCD).
First, let’s define a function for filtering the NLCD ImageCollection by year and select the landcover band. The function returns an Earth Engine ui.Map.Layer of the landcover band of the selected NLCD image. Note that as of this writing, NLCD spans nine epochs: 1992, 2001, 2004, 2006, 2008, 2011, 2013, 2016, and 2019. The 1992 data are primarily based on unsupervised classification of Landsat data, while the rest of the images rely on the imperviousness data layer for the urban classes and on a decision-tree classification for the rest. The 1992 image is not directly comparable to any later editions of NLCD (see the Earth Engine Data Catalog for more details, if needed). Therefore, we will use only the eight epochs after 2000 in this lab.
// Get an NLCD image by year. |
Our intention is to create a dropdown list so that when a particular epoch is selected, the corresponding NLCD image layer will be displayed on the map. We’ll define a dictionary with each NLCD epoch as the key and its corresponding NLCD image layer as the value. The keys of the dictionary (i.e., the eight NLCD epochs) will be used as the input to the dropdown lists (ui.Select) on the split-level map.
// Create a dictionary with each year as the key |
The split-panel map is composed of two individual maps, leftMap and rightMap. The map controls (e.g., zoomControl, scaleControl, mapTypeControl) will be shown only on rightMap. A control panel (ui.Panel) composed of a label (ui.Label) and a dropdown list (ui.Select) is added to each map. When an NLCD epoch is selected from a dropdown list, the function updateMap will be called to show the corresponding image layer of the selected epoch.
// Create the left map, and have it display the first layer. |
When displaying a land cover classification image on the Map, it would be useful to add a legend to make it easier for users to interpret the land cover type associated with each color. Let’s define a dictionary that will be used to construct the legend. The dictionary contains two keys: names (a list of land cover types) and colors (a list of colors associated with each land cover type). The legend will be placed in the bottom right of the Map.
// Set the legend title. |
With the legend dictionary defined above, we can now create a panel to hold the legend widget and add it to the Map. Each row on the legend widget is composed of a color box followed by its corresponding land cover type.
// Create a panel to hold the legend widget. |
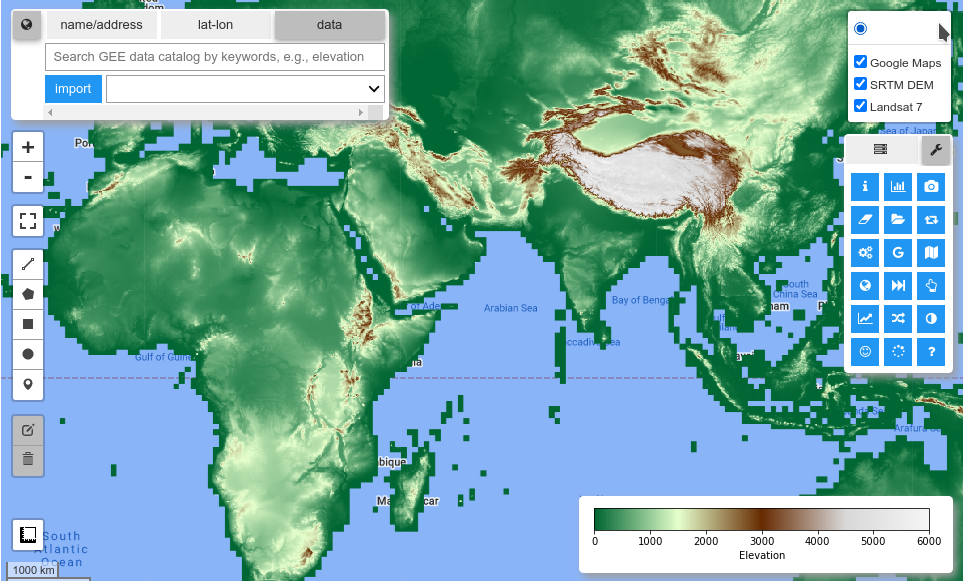
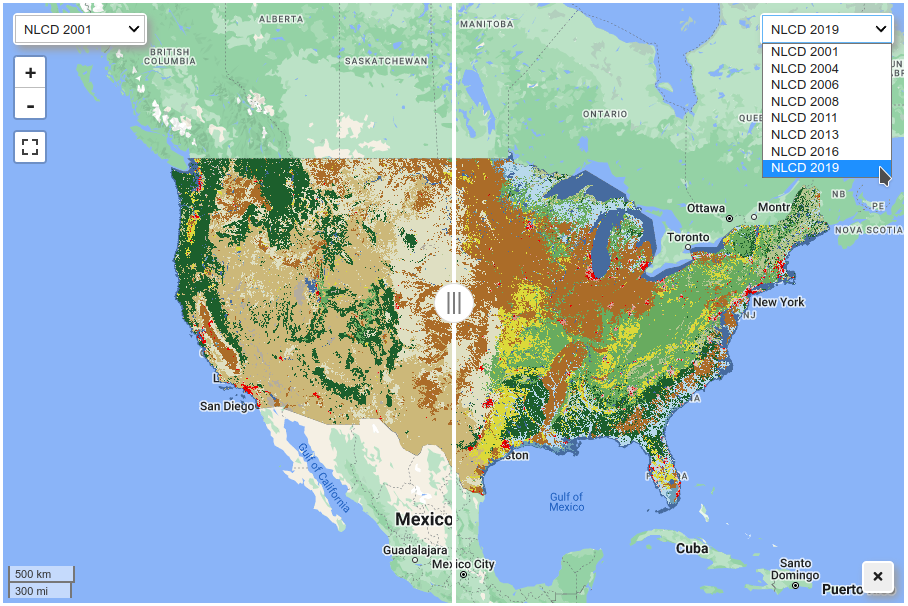
The last step is to create a split-panel map to hold the linked maps (leftMap and rightMap) and tie everything together. When users pan and zoom one map, the other map will also be panned and zoomed to the same extent automatically. When users select a year from a dropdown list, the image layer will be updated accordingly. Users can use the slider to swipe through and visualize land cover change easily (Fig. F6.3.2). Please make sure you minimize the Code Editor and maximize the Map so that you can see the dropdown widget in the upper-right corner of the map.
addCategoricalLegend(legend, dict, title); |
Code Checkpoint F63a. The book’s repository contains a script that shows what your code should look like at this point.
Fig. F6.3.2 A split-panel map for visualizing land cover change using NLCD |
Section 2. Publishing an Earth Engine App from the Code Editor
The goal of this section is to publish the Earth Engine App that we created in Sect. 1. The look and feel of interfaces changes often; if the exact windows described below change over time, the concepts should remain stable to help you to publish your App. First, load the script (see the Code Checkpoint in Sect. 1) into the Code Editor. Then, open the Manage Apps panel by clicking the Apps button above the script panel in the Code Editor (Fig. F6.3.3).
Fig. F6.3.3 The Apps button in the JavaScript Code Editor |

Now click on the New App button (Fig. F6.3.4).
Fig. F6.3.4 The New App button |

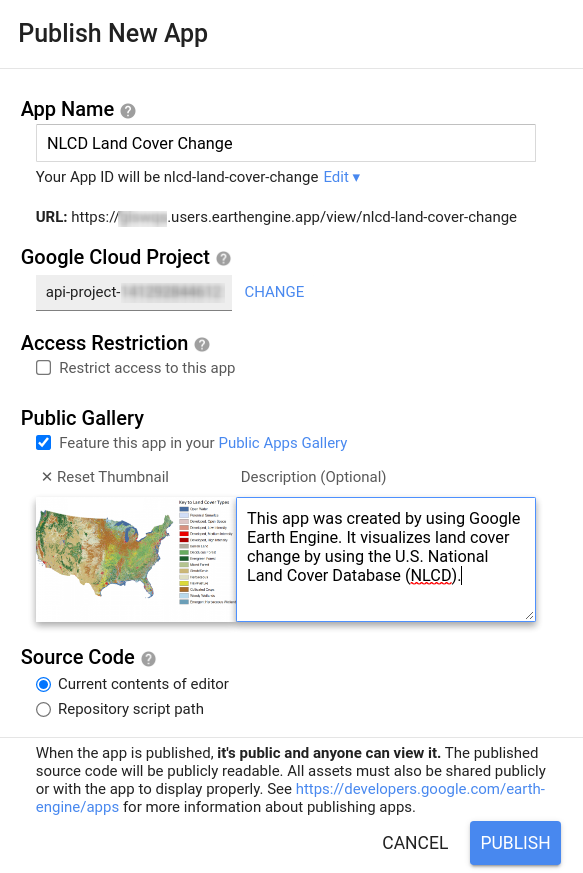
In the Publish New App dialog (Fig. F6.3.5), choose a name for the App (e.g., NLCD Land Cover Change), select a Google Cloud Project, provide a thumbnail to be shown in the Public Apps Gallery, and specify the location of the App’s source code. You may restrict access to the App to a particular Google Group or make it publicly accessible. Check Feature this app in your Public Apps Gallery if you would like this App to appear in your public gallery of Apps available at https://USERNAME.users.earthengine.app. When all fields are filled out and validated, the Publish button will be enabled; click it to complete publishing the App.
Fig. F6.3.5 The Publish New App dialog |
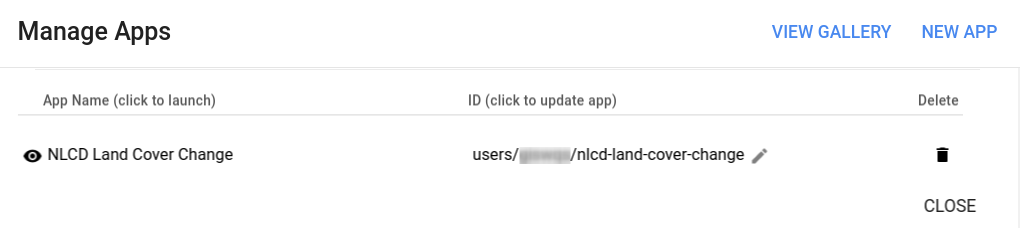
To manage an App from the Code Editor, open the Manage Apps panel (Fig. F6.3.6) by clicking the Apps button above the script panel in the Code Editor (Fig. F6.3.3). There, you can update your App’s configuration or delete the App.
Fig. F6.3.6 The Manage Apps panel |
Section 3. Developing an Earth Engine App Using geemap
In this section, you will learn how to develop an Earth Engine App using the geemap Python package and Jupyter Notebook. The geemap package is available on both PyPI (pip) and conda-forge. It is highly recommended that you create a fresh conda environment to install geemap.
Code Checkpoint F63b. The book’s repository contains information about setting up a conda environment and installing geemap.
Once you have launched a Jupyter notebook in your browser, you can continue with the next steps of the lab.
On the Jupyter Notebook interface, click the New button in the upper-right corner and select Python 3 to create a new notebook. Change the name of the notebook from “Untitled” to something meaningful (e.g., “nlcd_app”). With the newly created notebook, we can start writing and executing Python code.
First, let’s import the Earth Engine and geemap libraries. Press Alt + Enter to execute the code and create a new cell below.
import ee |
Create an interactive map by specifying the map center (latitude, longitude) and zoom level (1–18). If this is the first time you use geemap and the Earth Engine Python API, a new tab will open in your browser asking you to authenticate Earth Engine. Follow the on-screen instructions to authenticate Earth Engine.
Map=geemap.Map(center=[40, -100], zoom=4) |
Retrieve the NLCD 2019 image by filtering the NLCD ImageCollection and selecting the landcover band. Display the NLCD 2019 image on the interactive Map by using Map.addLayer.
# Import the NLCD collection. |
Next, add the NLCD legend to the Map. The geemap package has several built-in legends, including the NLCD legend. Therefore, you can add the NLCD legend to the Map by using just one line of code (Map.add_legend).
title='NLCD Land Cover Classification' |
Alternatively, if you want to add a custom legend, you can define a legend dictionary with labels as keys and colors as values, then you can use Map.add_legend to add the custom legend to the Map.
legend_dict={ |
The Map with the NLCD 2019 image and legend should look like Fig. F6.3.7.
Fig. F6.3.7 The NLCD 2019 image layer displayed in geemap |

The Map above shows only the NLCD 2019 image. To create an Earth Engine App for visualizing land cover change, we need a stack of NLCD images. Let’s print the list of system IDs of all available NLCD images.
dataset.aggregate_array('system:id').getInfo() |
The output should look like this.
['USGS/NLCD_RELEASES/2019_REL/NLCD/2001', |
Select the eight NLCD epochs after 2000.
years=['2001', '2004', '2006', '2008', '2011', '2013', '2016', '2019'] |
Define a function for filtering the NLCD ImageCollection by year and select the 'landcover' band.
# Get an NLCD image by year. |
Create an NLCD ImageCollection to be used in the split-panel map.
# Create an NLCD image collection for the selected years. |
Print out the list of system IDs of the selected NLCD images covering the contiguous United States.
collection.aggregate_array('system:id').getInfo() |
The output should look like this.
['USGS/NLCD_RELEASES/2019_REL/NLCD/2001', 'USGS/NLCD_RELEASES/2019_REL/NLCD/2013', |
Next, create a list of labels to populate the dropdown list.
labels=[f'NLCD{year}' for year in years] |
The output should look like this.
['NLCD 2001', 'NLCD 2016', |
The last step is to create a split-panel map by passing the NLCD ImageCollection and list of labels to Map.ts_inspector.
Map.ts_inspector(left_ts=collection, right_ts=collection, left_names=labels, right_names=labels) |
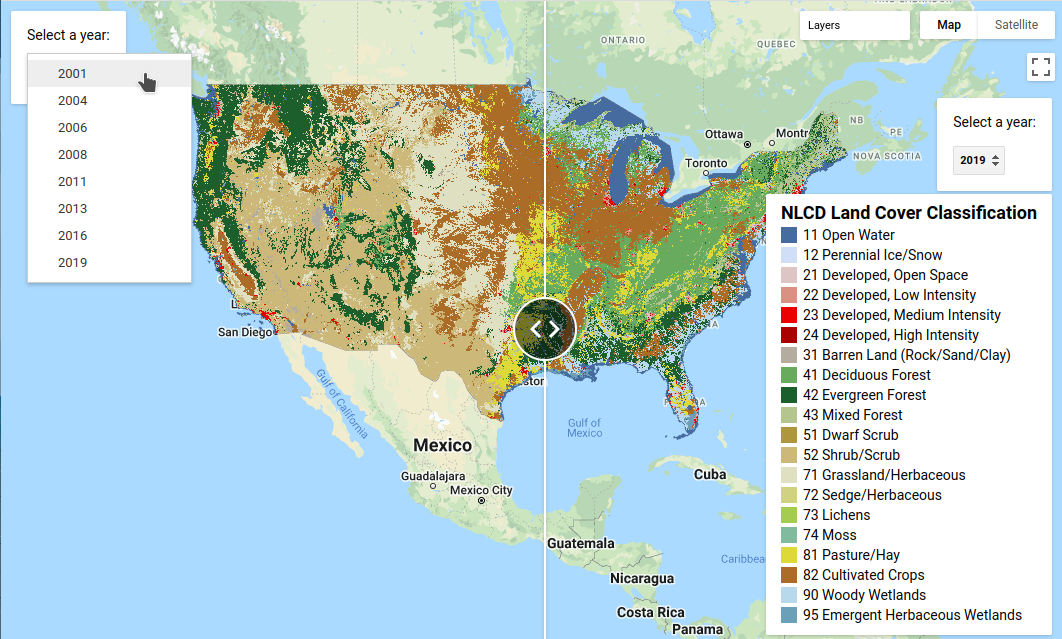
The split-panel map should look like Fig. F6.3.8.
Fig. F6.3.8 A split-panel map for visualizing land cover change with geemap |
To visualize land cover change, choose one NLCD image from the left dropdown list and another image from the right dropdown list, then use the slider to swipe through to visualize land cover change interactively. Click the close button in the bottom-right corner to close the split-panel map and return to the NLCD 2019 image shown in Fig. F6.3.7.
Code Checkpoint F63c. The book’s repository contains information about what your code should look like at this point.
Section 4. Publishing an Earth Engine App Using a Local Web Server
In this section, you will learn how to deploy an Earth Engine App using a local computer as a web server. Assume that you have completed Sect. 3 and created a Jupyter notebook named nlcd_app.ipynb. First, you need to download ngrok, a program that can turn your computer into a secure web server and connect it to the ngrok cloud service, which accepts traffic on a public address. Download ngrok from https://ngrok.com and unzip it to a directory on your computer, then copy nlcd_app.ipynb to the same directory. Open the Anaconda Prompt (on Windows) or the Terminal (on macOS/Linux) and enter the following commands. Make sure you change /path/to/ngrok/dir to your computer directory where the ngrok executable is located, e.g., ~/Downloads.
cd /path/to/ngrok/dir conda activate gee |
The output of the terminal should look like this.
Fig. F6.3.9 The output of the terminal running Voilà |
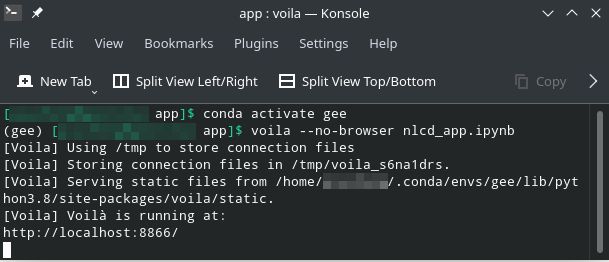
Voilà can be used to run, convert, and serve a Jupyter notebook as a standalone app. Click the link (e.g., http://localhost:8866) shown in the terminal window to launch the interactive dashboard. Note that the port number is 8866, which is needed in the next step to launch ngrok. Open another terminal and enter the following command.
cd /path/to/ngrok/dir ngrok http 8866 |
The output of the terminal should look like Fig. F6.3.10. Click the link shown in the terminal window to launch the interactive dashboard. The link should look like https://random-string.ngrok.io, which is publicly accessible. Anyone with the link will be able to launch the interactive dashboard and use the split-panel map to visualize NLCD land cover change. Keep in mind that the dashboard might take several seconds to load, so please be patient.
Fig. F6.3.10 The output of the terminal running ngrok |

To stop the web server, press Ctrl + C on both terminal windows. See below for some optional settings for running Voilà and ngrok.
To show code cells from your App, run the following from the terminal.
voila --no-browser --strip_sources=False nlcd_app.ipynb |
To protect your App with a password, run the following.
ngrok http -auth="username:password" 8866 |
Section 5. Publish an Earth Engine App Using Cloud Platforms
In this section, you will learn how to deploy an Earth Engine App on cloud platforms, such as Heroku and Google App Engine. Heroku is a “platform as a service” that enables developers to build, run, and operate applications entirely in the cloud. It has a free tier with limited computing hours, which would be sufficient for this lab. Follow the steps below to deploy the Earth Engine App on Heroku.
First, go to https://github.com/signup to sign up for a GitHub account if you don’t have one already. Once your GitHub account has been created, log into your account and navigate to the sample app repository: https://github.com/giswqs/earthengine-apps. Click the Fork button in the top-right corner to fork this repository into your account. Two important files in the repository are worth mentioning here: requirements.txt lists the required packages (e.g., geemap) to run the App, while Procfile specifies the commands that are executed by the App on startup. The content of Procfile should look like this.
web: voila --port=$PORT --no-browser --strip_sources=True --enable_nbextensions=True --MappingKernelManager.cull_interval=60 --MappingKernelManager.cull_idle_timeout=120 notebooks/ |
The above command instructs the server to hide the source code and periodically check for idle kernels—in this example, every 60 seconds—and cull them if they have been idle for more than 120 seconds. This can avoid idle kernels using up the server computing resources. The page served by Voilà will contain a list of any notebooks in the notebooks directory.
Next, go to https://signup.heroku.com to sign up for a Heroku account if you don’t have one already. Log into your account and click the New button in the top-right corner, then choose Create new app from the dropdown list (Fig. F6.3.11).
Fig. F6.3.11 Creating a new app in Heroku |

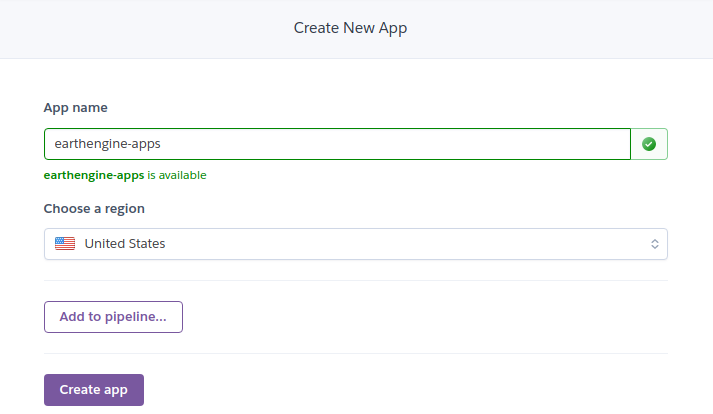
Choose a name for your App (Fig. F6.3.12). Note that the App name must be unique; if an App name has already been taken, you won’t be able to use it.
Fig. F6.3.12 Choosing an App name |
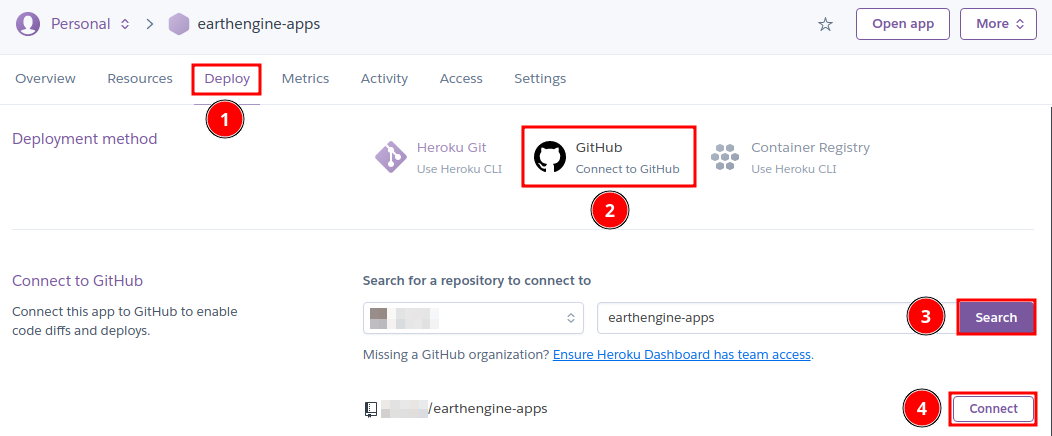
Once the Heroku App has been created, click the Deploy tab and choose GitHub as the deployment method. Connect to your GitHub account and enter earthengine-apps in the search box. The repository should be listed beneath the search box. Click the Connect button to connect the repository to Heroku (Fig. F6.3.13).
Fig. F6.3.13 Connecting a GitHub account to Heroku |
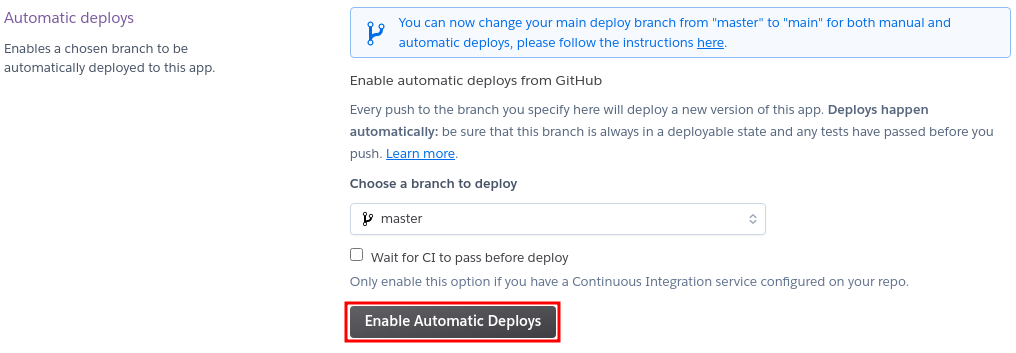
Under the same Deploy tab, scroll down and click Enable Automatic Deploys (Fig. F6.3.14). This will enable Heroku to deploy a new version of the App whenever the GitHub repository gets updated.
Fig. F6.3.14 Enabling Automatic Deploys on Heroku |
Since using Earth Engine requires authentication, we need to set the Earth Engine token as an environment variable so that the web App can pass the Earth Engine authentication. If you have completed Sect. 3, you have successfully authenticated Earth Engine on your computer and the token can be found in the following file path, depending on the operating system you are using. Note that you might need to show the hidden directories on your computer in order to see the .config folder under the home directory.
Windows: C:\Users\USERNAME\.config\earthengine\credentials |
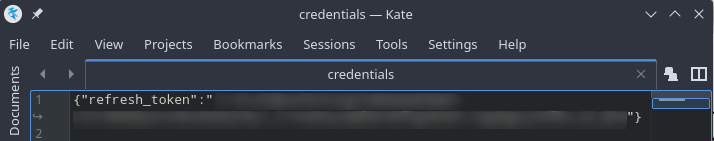
Open the credentials file using a text editor. Select and copy the long string wrapped by the double quotes (Fig. F6.3.15). Do not include the double quotes in the copied string.
Fig. F6.3.15 The Earth Engine authentication token |
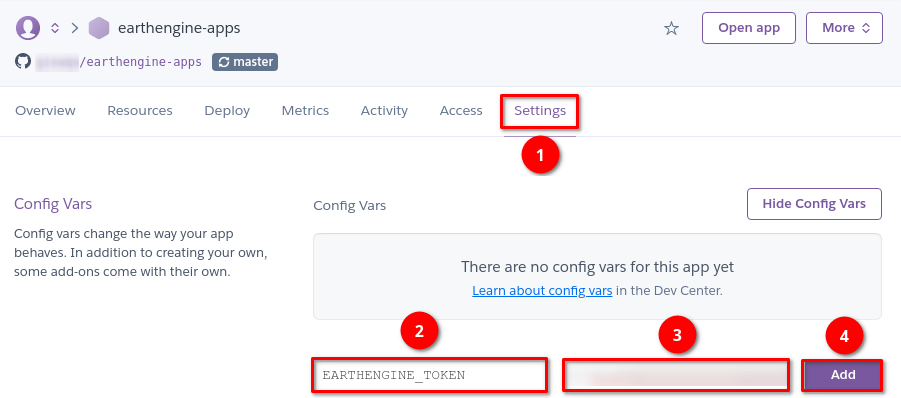
Next, navigate to your web App on Heroku. Click the Settings tab, then click Reveal Config Vars on the page. Enter EARTHENGINE_TOKEN as the key and paste the string copied above as the value. Click the Add button to set EARTHENGINE_TOKEN as an environment variable (Fig. F6.3.16) that will be used by geemap to authenticate Earth Engine.
Fig. F6.3.16 Setting the Earth Engine token as an environment variable on Heroku |
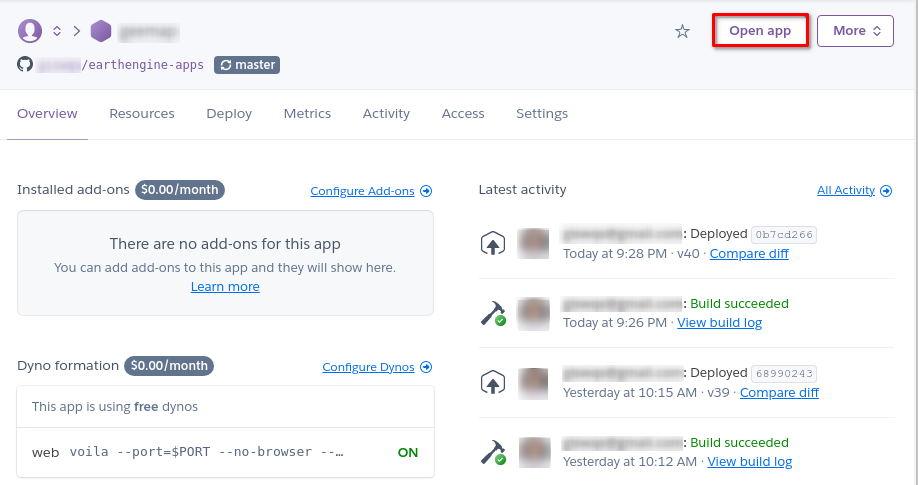
The last step is to commit some changes to your forked GitHub repository to trigger Heroku to build and deploy the App. If you are familiar with Git commands, you can push changes to the repository from your local computer to GitHub. If you have not used Git before, you can navigate to your repository on GitHub and make changes directly using the browser. For example, you can navigate to README.md and click the Edit icon on the page to start editing the file. Simply place the cursor at the end of the file and press Enter to add an empty line to the file, then click the Commit changes button at the bottom of the page to save changes. This should trigger Heroku to build the App. Check the build status under the latest activities of the Overview tab. Once the App has been built and deployed successfully, you can click the Open app button in the top-right corner to launch the web App (Fig. F6.3.17). When the App is open in your browser, click nlcd_app.ipynb to launch the split-panel map for visualizing land cover change. This is the same notebook that we developed in Sect. 3. The App URL should look like this: https://APP-NAME.herokuapp.com/voila/render/nlcd_app.ipynb.
Congratulations! You have successfully deployed the Earth Engine App on Heroku.
Fig. F6.3.17 Setting the Earth Engine token as an environment variable on Heroku |
Code Checkpoint F63d. The book’s repository contains information about what your code should look like at this point.
Question 1. What are the pros and cons of designing Earth Engine Apps using geemap and ipywidgets, compared to the JavaScript Earth Engine User Interface API?
Question 2. What are the pros and cons of deploying Earth Engine Apps on Heroku, compared to a local web server and the Earth Engine Code Editor?
Synthesis
Assignment 1. Replace the NLCD datasets with other multitemporal land cover datasets (e.g., United States Department of Agriculture National Agricultural Statistics Service Cropland Data Layers, visible in the Earth Engine Data Catalog) and modify the web App for visualizing land cover change using the chosen land cover datasets. Deploy the web App using multiple platforms (i.e., JavaScript Code Editor, ngrok, and Heroku). More land cover datasets can be found at https://developers.google.com/earth-engine/datasets/tags/landcover.
Conclusion
In this chapter, you learned how to design Earth Engine Apps using both the Earth Engine User Interface API (JavaScript) and geemap (Python). You also learned how to deploy Earth Engine Apps on multiple platforms, such as the JavaScript Code Editor, a local web server, and Heroku. The skill of designing and deploying interactive Earth Engine Apps is essential for making your research and data products more accessible to the scientific community and the general public. Anyone with the link to your web App can analyze and visualize Earth Engine datasets without needing an Earth Engine account.
Feedback
To review this chapter and make suggestions or note any problems, please go now to bit.ly/EEFA-review. You can find summary statistics from past reviews at bit.ly/EEFA-reviews-stats.
References
Cloud-Based Remote Sensing with Google Earth Engine. (n.d.). CLOUD-BASED REMOTE SENSING WITH GOOGLE EARTH ENGINE. https://www.eefabook.org/
Cloud-Based Remote Sensing with Google Earth Engine. (2024). In Springer eBooks. https://doi.org/10.1007/978-3-031-26588-4
- Earth Engine User Interface API: https://developers.google.com/earth-engine/guides/ui
- Earth Engine Apps: https://developers.google.com/earth-engine/guides/apps
- Voilà: https://voila.readthedocs.io
- geemap: https://geemap.org
- ngrok: https://ngrok.com
- Heroku: https://heroku.com
- Earthengine-apps: https://github.com/giswqs/earthengine-apps